Edmonton’s Urban Sprawl: Gone for Good?
Thu, 04 MayEdmonton has a reputation for its low population density and large sprawl. Although it’s great to have space in our beautiful city, it may come at the cost of trying to provide services to outlying communities. We wrote about urban sprawl before, with great discussion from the Edmonton community about the pros and cons.
Last year, the city of Edmonton reported it would cost $1.4-billion to support Edmonton’s last three growth areas. It’s worth the time to check out Mayor Don Iveson’s take on urban sprawl here. With this in mind, the city has been encouraging different options including infill development and the implementation of garage suites to try and boost the number of people living near Edmonton’s core. So we thought it would be interesting to look at the latest release from Statistics Canada’s dwelling census data.
Officially, the cities of Edmonton and Toronto occupy about the same land area, but Toronto has three times the population! The good news is that the land area that the City of Edmonton occupies has remained relatively unchanged since 2001. The population density has also increased by 15 per cent since 2011. That means for every square kilometre, there are about 175 more residents.
However, the question is how much of this is due to higher density housing, versus just new development in previously undeveloped areas of the city? The census only reports on the total land size of the city, not on how much of that land is undeveloped versus developed.
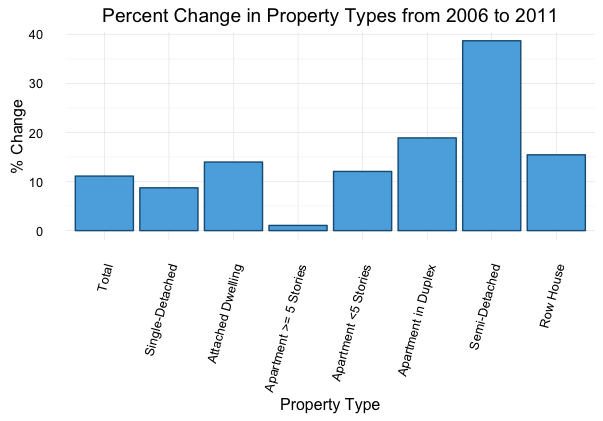
We decided to dig deeper and compare the change in the type of housing occupied by Edmontonians. Overall, there seems to be a marked increase in people living in medium-density housing. The growth since 2011 in single detached houses was slightly lower than the total growth of number of properties in Edmonton. On the other hand, growth in attached dwellings was higher, at 14 per cent. The largest growth was with semi-detached houses at 39 per cent.
It will be interesting to see if this increase in medium-density housing will be enough for Edmonton in the future, or if we will need to move towards more high-density housing like apartment buildings. Will Edmonton residents be willing to give up their space to keep the city sprawl down? Or will we even have a choice as the city reaches its outer size limits?
At TruHome, we are committed to keeping up with and analyzing the most current data to help you better understand projected growth and housing trends in the City of Edmonton.